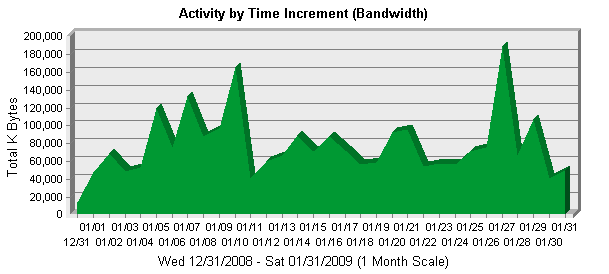
| Summary of Activity by Time Increment |
|
|
|
Time Interval
|
Hits
|
Page Views
|
KBytes Transferred
|
Visitor Sessions
|
|
Wed 12/31/2008 |
144 |
87 |
13,915 K |
35 |
|
Thu 01/01/2009 |
737 |
275 |
47,769 K |
148 |
|
Fri 01/02/2009 |
1,085 |
442 |
69,135 K |
176 |
|
Sat 01/03/2009 |
872 |
216 |
49,071 K |
147 |
|
Sun 01/04/2009 |
837 |
341 |
53,722 K |
172 |
|
Mon 01/05/2009 |
1,574 |
736 |
119,511 K |
223 |
|
Tue 01/06/2009 |
1,323 |
422 |
76,334 K |
229 |
|
Wed 01/07/2009 |
2,001 |
635 |
133,225 K |
218 |
|
Thu 01/08/2009 |
1,691 |
474 |
87,806 K |
272 |
|
Fri 01/09/2009 |
1,136 |
387 |
97,199 K |
200 |
|
Sat 01/10/2009 |
1,100 |
492 |
165,407 K |
189 |
|
Sun 01/11/2009 |
826 |
334 |
40,794 K |
188 |
|
Mon 01/12/2009 |
1,664 |
357 |
59,796 K |
200 |
|
Tue 01/13/2009 |
1,941 |
366 |
67,413 K |
234 |
|
Wed 01/14/2009 |
1,844 |
360 |
88,785 K |
276 |
|
Thu 01/15/2009 |
1,729 |
358 |
71,255 K |
229 |
|
Fri 01/16/2009 |
1,311 |
302 |
87,866 K |
212 |
|
Sat 01/17/2009 |
930 |
290 |
72,376 K |
181 |
|
Sun 01/18/2009 |
1,054 |
319 |
56,845 K |
160 |
|
Mon 01/19/2009 |
1,242 |
529 |
59,295 K |
211 |
|
Tue 01/20/2009 |
1,570 |
532 |
92,348 K |
254 |
|
Wed 01/21/2009 |
1,449 |
412 |
95,964 K |
253 |
|
Thu 01/22/2009 |
1,803 |
462 |
54,466 K |
263 |
|
Fri 01/23/2009 |
1,443 |
462 |
58,213 K |
242 |
|
Sat 01/24/2009 |
1,010 |
466 |
57,061 K |
159 |
|
Sun 01/25/2009 |
1,136 |
491 |
70,813 K |
189 |
|
Mon 01/26/2009 |
1,198 |
475 |
75,531 K |
230 |
|
Tue 01/27/2009 |
1,593 |
593 |
189,070 K |
243 |
|
Wed 01/28/2009 |
1,368 |
472 |
66,831 K |
274 |
|
Thu 01/29/2009 |
1,325 |
367 |
107,121 K |
254 |
|
Fri 01/30/2009 |
1,128 |
471 |
40,657 K |
255 |
|
Sat 01/31/2009 |
958 |
402 |
50,491 K |
155 |
|
Total
|
41,022
|
13,327
|
2,476,085 K
|
6,671
|
|